We founded Idibon with the objective of bringing large scale information processing to as much of the world as possible, having all worked in both the technology and not-for-profit sectors. In an auspicious start to our goal of building a company with the power to have a positive impact on the world, Schuyler Erle spent his first full-time week on the job responding to Hurricane Sandy’s landfall in New York.
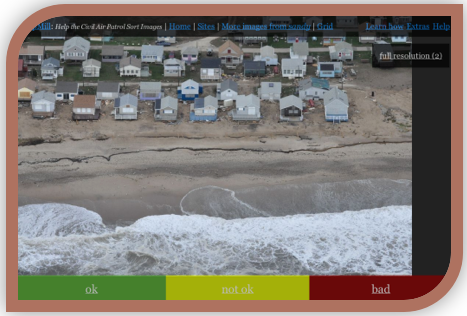
Aerial image of the damage, with a screen-shot of the task that volunteers used to rate the damage.
November 1st of 2012 was scheduled to be the first full-time day for Schuyler, our co-founder and CTO, here in San Francisco, but we received a call saying that he was stranded in New York and was being asked to help with FEMA’s damage assessment following Hurricane Sandy’s landfall. Six months earlier, Schuyler, Idibon’s CEO, Robert Munro, and a small number of people from Humanitarian Open Street Map and Geeks Without Bounds had worked with FEMA and Civil Air Patrol to develop a method to quickly crowdsource aerial imagery analysis. Schuyler and Rob had first met working to respond to humanitarian crises together, and continue to work and consult in this area. Idibon was unanimous in our agreement to support the response to Sandy, which we continued after the response period by using our crowdsourcing skills to evaluate the effectiveness of the response.
The Civil Air Patrol (CAP) were taking over 35,000 GPS-tagged images in fly-overs of damage-affected areas. This was performed as part of their mandate to provide aerial photographs for disaster assessment and response agencies, primarily FEMA, who used the aggregate geolocated data for situational awareness. The scale of the destruction meant that there was a relatively large amount of photographs for a single disaster. As a result, it was the first time that CAP and FEMA used distributed third-party information processing for the damage assessment.
Schuyler ran a crowdsourcing platform where public volunteers were asked to evaluate the level of damage present in the images. The contributors viewed one image at a time and gave a three-way judgment: little/no damage; medium damage; or heavy damage. Today, we announce the release of two reports regarding the quality of the damage assessment evaluating the volunteer workers’ performance in three ways:
1. Inter-annotator agreement: how often did volunteers agree with each other?
2. Comparison with experts: 11 expert raters from the GIS Corps assessed a selection of the images as part of this report (also as volunteers).
3. Ground-truthed ratings: comparison to ratings made by FEMA at the same grid locations.
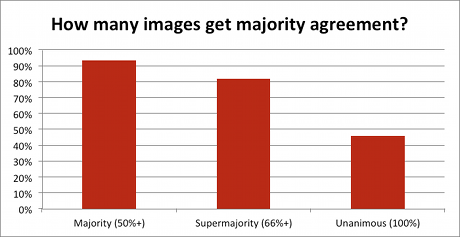
Inter-annotator agreement for the damage assessments, showing a low rate of overall agreement, but a high rate of majority agreement. See the reports for suggested strategies that optimize the overall assessment from conflicting individual reports.
We are extremely grateful to the volunteers who helped with the damage assessment, and to everyone who helped with the software and analysis. The volunteers used the MapMill software developed by Jeff Warren and released by the Public Laboratory for Open Technology and Science (PLOTS) and adapted for this task by Humanitarian OpenStreetMap. The platform was developed at Camp Roberts RELIEF, organized by John Crowley. The GIS Corps volunteers were managed by Shoreh Elhami. Jennifer Chan supported both the deployment and the analysis.
– Rob Munro